The stretch run of the abbreviated 2020 MLB regular season has arrived. There are 12 days remaining in the season, then 16 clubs will venture into the postseason. The best-of-three Wild Card Series will be followed by the LDS and LCS in bubbles in Southern California and Texas. The World Series will take place at Globe Life Field in Arlington.
With that in mind, it's time for our weekly look at various trends around the league. Last week we examined Edwin Diaz's excellent but also weird season, among other things. Now here are three other trends to keep an eye on.
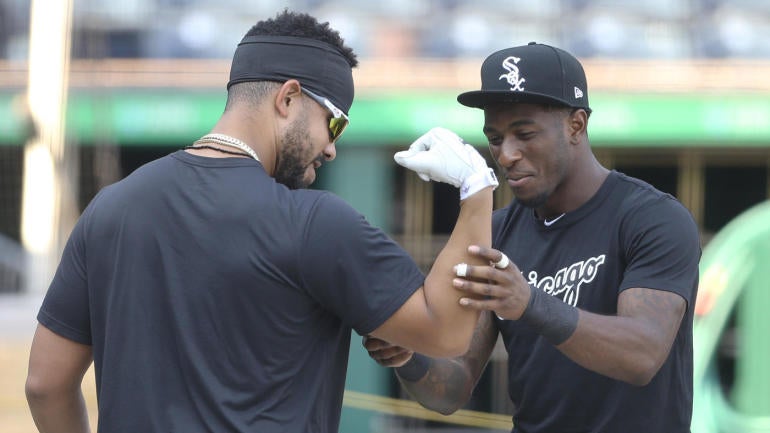
Anatomy of a white (sox) hot streak
On Aug. 15, the Chicago White Sox were swept by the Cardinals in a doubleheader at home -- those were St. Louis' first two games following their COVID-19 shutdown -- to drop to 10-11 on the season. They were three games out of first place in the AL Central and a half-game behind the Tigers for the No. 8 postseason seed, and an early season disappointment.
"It just seemed like we were taking a night off," Dallas Keuchel told reporters a few days prior to the doubleheader. "We can't afford that with a young core that we have here. We've got to show up every day, and even if there's no fans, we've got to make sure that we're ready to go. And if we're not ready to go, we've got to fake it until we make it."
Since that Aug. 15 doubleheader sweep, the White Sox are 22-5 and they've outscored their opponents by 91 runs -- 91 runs! -- in those 27 games. They're three games up on the Twins and six games up on the Indians. At 32-16, the ChiSox have the best record in the American League and their magic number to clinch a postseason spot -- their first since 2008 -- is three.
How have they turned their season around and climbed atop the American League standings? It takes a total team effort, of course, but here are the three biggest reasons.
1. Two MVP candidates. The White Sox are averaging 5.46 runs per game this year, most in the American League, and they pace the Junior Circuit with 80 home runs. Eloy Jimenez is having a breakout season and Luis Robert is right there with Kyle Lewis for the AL Rookie of the Year award. Yasmani Grandal and Nick Madrigal have been very good too. The offense is fearsome.
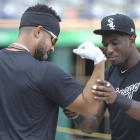
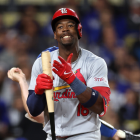
The leaders of the attack have been leadoff hitter Tim Anderson and cleanup hitter Jose Abreu, both of whom are firmly in the AL MVP discussion. Anderson is hitting .377 and on track to win his second straight batting title while Abreu leads the world with 48 RBI. He led the league with 123 RBI last season. It's been 20 years since a qualified hitter finished with more RBI than games played (Manny Ramirez had 122 RBI in 118 games in 2000). Abreu could do it this year.
By OPS+, Abreu and Anderson have been two of the 12 best hitters in baseball this season, and they've been especially good during this 22-5 stretch. Check it out:
| PA | AVG/OBP/SLG | HR | RBI | 2020 WAR | |
|---|---|---|---|---|---|
1B Jose Abreu | 121 | .389/.421/.779 | 12 | 36 | 2.4 |
SS Tim Anderson | 127 | .393/.433/.607 | 6 | 16 | 2.1 |
"(Abreu) definitely, he deserves it. You see the numbers. You see what he's doing," Anderson told reporters, including MLB.com's Scott Merkin, when asked about the MVP race earlier this week. "Every time there's a runner on, he's getting them in. And I couldn't be more proud to be right in the mix with him. He's definitely been playing his butt off, and he's been competing every night. I'm rooting for him. I hope he gets it."
I suppose Abreu and Anderson could take MVP votes away from each other -- that's not really a thing that happens, it's just a neat talking point -- but ultimately it doesn't really matter. Both have been fantastic and they're both White Sox, so it's not like the team has to pick between the two. Abreu and Anderson are the primary reasons Chicago is sitting atop the AL standings with less than two weeks remaining in the season.
"You've all heard a lot from the guys about Jose's leadership and what he means to some of the younger players, and TA not only being one of the high-energy driving forces behind this team but also one of the emerging faces of baseball," White Sox GM Rick Hahn told Merkin earlier this week. "It's just fantastic and well-deserved for both of them."
2. Cease and Dunning have stabilized the rotation. The White Sox were facing a bit of a pitching crisis earlier this year. Michael Kopech opted out of the season and Carlos Rodon (shoulder) and Reynaldo Lopez (shoulder) were on the injured list. Chicago was short on rotation options and they didn't add any help at the deadline either. They instead solved their pitching internally.
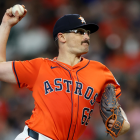
Youngsters Dylan Cease (part of the Jose Quintana trade) and Dane Dunning (part of the Adam Eaton trade) have stepped in and solidified the rotation behind Keuchel, ace Lucas Giolito, and veteran lefty Gio Gonzalez (Gonzalez has since been demoted to the bullpen). Dunning held the Twins to two runs (one earned) in seven innings Tuesday night. Here's what he and Cease have done during this 22-5 streak:
| GS | IP | ERA | WHIP | K% | BB% | HR/9 | |
|---|---|---|---|---|---|---|---|
Dylan Cease | 6 | 31 1/3 | 3.16 | 1.37 | 14.9% | 14.2% | 1.15 |
Dane Dunning | 5 | 27 | 2.33 | 0.93 | 25.9% | 8.3% | 0.67 |
Dylan's near one-to-one strikeout-to-walk ratio suggests regression is coming, though those six starts are in the bank. He allowed no more than three runs in all six starts and no more than two runs in five of the six starts. They happened and they helped the White Sox move into first place. Regression is something to worry about another day.
Dunning missed the entire 2019 season with Tommy John surgery but he's a former first round pick (29th overall in 2016) and MLB.com ranks him as Chicago's seventh best prospect. "(He was) displaying nice feel for pitching and the ability to throw strikes with all of his offerings," says their scouting report. Dunning threw five no-hit innings in is second big league start last month.
Somewhat surprisingly, the White Sox did not make any additions at the trade deadline, though that looks smart now. Cease has been a solid contributor and Dunning has been a revelation, helping settle down a rotation situation that was quite chaotic a few weeks ago. Right now both have to be in consideration to start Game 3 of the Wild Card Series, if necessary.
3. The three-headed bullpen monster. The White Sox have held the lead after six innings 22 times during this 22-5 stretch and they are 19-3 in those 22 games. On three other occasions the game was tied after six innings, and Chicago won two of those three games. The bullpen has consistently turned late leads into wins.
Chicago's bullpen went into Tuesday's game with a 3.71 ERA, the sixth best in MLB, as well as 54 shutdowns, third most in MLB. Shutdowns are relief appearances that improve the team's win probability at least six percent. Conversely, meltdowns are relief appearances that hurt the team's win probability at least six percent. The White Sox bullpen has the tenth fewest meltdowns (26).
Protecting those late leads have been veteran righties Alex Colome and Evan Marshall, and rookie righty Matt Foster. Foster has quickly emerged as one of manager Rick Renteria's most trusted bullpen arm, and he's even started two games as an opener. Those three have been lights out during this 22-5 streak.
| IP | ERA | WHIP | K% | BB% | HR/9 | |
|---|---|---|---|---|---|---|
Alex Colome | 11 | 1.64 | 1.27 | 17.0% | 14.9% | 0.00 |
Matt Foster | 11 2/3 | 2.31 | 1.11 | 20.8% | 6.3% | 0.77 |
Evan Marshall | 12 1/3 | 2.19 | 0.89 | 36.0% | 4.1% | 0.00 |
Codi Heuer, another rookie righty, deserves a shoutout here. He has a 2.04 ERA with a solid 24.6 percent strikeout rate in 17 2/3 innings this season. That said, Heuer is no higher than No. 4 on the bullpen depth chart, and that's a pretty good arm to have out there as your fourth option. Chicago's bullpen has been sneaky good while the team has been in-our-face great.
Hosmer getting airborne


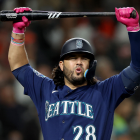
The first two seasons of Eric Hosmer's massive eight-year contract with the San Diego Padres did not go according to plan. The soon-to-be 31-year-old authored a .259/.316/.412 batting line from 2018-19 that was roughly league average overall but well below the .254/.335/.450 batting line put up by first basemen league-wide.
Even during his glory days with the Royals, Hosmer had a knack for hitting the ball in the ground, which limited his power output. Only twice in seven seasons with Kansas City did he reach 20 homers, and he routinely posted ground ball rates higher than the league average:
- 2015: 52.0 percent (24th highest among qualified hitters)
- 2016: 58.9 percent (2nd highest)
- 2017: 55.6 percent (4th highest)
That trend continued in 2018 and 2019. Hosmer's 58.2 percent ground ball rate in his first two seasons with the Padres was easily the highest in baseball -- Ian Desmond was a distant second at 55.4 percent -- and there was far too much of this:
Middle-middle fastballs being pounded into the ground rather than driven with authority to the outfield. That will happen to even the very best hitters, sometimes you just miss your pitch, but it's happened with Hosmer far too often. That led to some soul-searching over the winter. In February, Hosmer told The Athletic's Andy McCullough he intended to be a different hitter this season:
"I've got to get the ball in the air a little more," Hosmer said. "I've got to drive the ball a little more. I hit the ball really hard. It just goes on the ground."
...
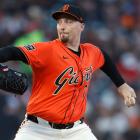
Hosmer is trying to rectify that deficiency this spring. He has concentrated on maintaining his balance in his back leg to prevent his upper half from diving downward and altering his swing. "I'm confident that if I get my mechanics back and stay behind the ball, righty, lefty, I can hit whoever — except (Madison) Bumgarner," Hosmer said. He burst into laughter. "He's just got that angle, man. And 2014, just brings back nightmares."
Hosmer has indeed been a different hitter this season. Prior to landing on the injured list with a broken finger -- he broke the finger trying to lay down a bunt, if you can believe that -- Hosmer was hitting .288/.344/.542 with eight home runs in 31 games. He hit his eighth homer in his 63rd game in 2018 and in his 52nd game in 2019.
Hosmer's ground ball rate is down to 46.3 percent this year and his average exit velocity, which was never bad to begin with, is currently 91.4 mph, the highest it's been since 2016 (92.0 mph). Nearly half (49.5 percent, to be exact) of his balls in play have been hit 95 mph or better, putting Hosmer among the top eight percent in baseball.
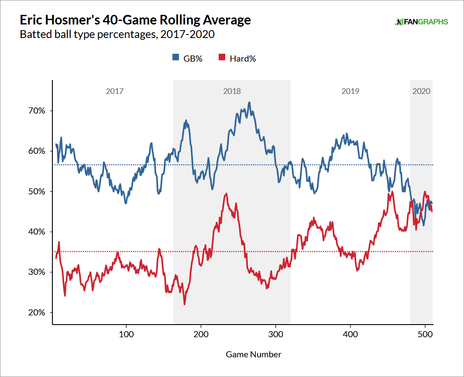
Among the 188 qualified hitters, only five have raised their launch angle more than Hosmer (6.5 degrees) from 2019 to 2020, and only seven have lowered their ground ball rate more (9.4 percent). Hit the ball hard and hit the ball in the air and good things tend to happen. Very good things. The numbers don't lie:
- MLB averages on ground balls: .236 batting average and .259 slugging percentage
- MLB averages on fly balls and line drives: .466 batting average and .929 slugging percentage
Hosmer did not have a splint on his finger during a workout earlier this week, according to the San Diego Union-Tribune's Kevin Acee, which suggests he is on the mend and not expected to miss much more time. The Padres have a great Plan B at first base in Mitch Moreland, but they're a better team with Moreland and this version of Hosmer in the lineup. This version of Hosmer is a difference-maker worth his contract.
NL could outscore AL
Something notable happened last season and it flew completely under the radar: American League teams outscored National League teams by only 0.10 runs per game (4.88 to 4.78), the closest the two leagues finished in scoring since the AL held a 4.01 to 3.98 advantage in 1976, the fourth year of the designated hitter. The NL has not outscored the AL since 1974 (4.15 to 4.10).
Going into Tuesday night's games, the NL held a 4.76 to 4.64 runs per game advantage over the AL. The top three and six of the top seven highest scoring teams reside in the Senior Circuit. The head-to-head numbers:
| Runs per game | AVG/OBP/SLG | HR per game | BB% | K% | |
|---|---|---|---|---|---|
National League | 4.76 | .248/.327/.424 | 1.30 | 9.3% | 22.9% |
American League | 4.64 | .244/.321/.417 | 1.30 | 9.2% | 23.5% |
If you want to carry it out to an extra decimal place, NL teams lead 1.303 to 1.296 in homers per game, so across the board they've outproduced their AL counterparts. They've been better with runners in scoring position too, hitting .261/.350/.434 to the AL's .251/.341/.427 line in those situations. Hitting with runners at second and/or third base always boosts the ol' run scoring.
DH production across the two leagues is very similar. AL DHs are hitting .231/.318/.413 this year while NL DHs are hitting .234/.315/.411. Considering NL teams did not have an offseason to tailor their roster for the universal DH -- it was dropped on them during the shutdown -- that's impressive. NL pitchers hit .131/.161/.168 last season, remember. Now those at-bats go to real hitters.
The universal DH certainly contributes to the NL outscoring the AL this year but it alone does not explain it. NL teams are receiving significantly better production than AL teams at four of the nine positions:
| American League | National League | |
|---|---|---|
Catcher | 89 wRC+ | 89 wRC+ |
First base | 112 wRC+ | 115 wRC+ |
Second base | 88 wRC+ | 82 wRC+ |
Shortstop | 97 wRC+ | 110 wRC+ |
Third base | 109 wRC+ | 101 wRC+ |
Left field | 99 wRC+ | 109 wRC+ |
Center field | 105 wRC+ | 95 wRC+ |
Right field | 105 wRC+ | 115 wRC+ |
Designated hitter | 98 wRC+ | 94 wRC+ |
Weighted runs created plus, or wRC+, is a catch-all statistic that adjusts for era and ballpark, and presents offensive output relative to the league average, where 100 is average. Anything higher than 100 is above-average (a 125 wRC+ is 25 percent better than league average, for example) and anything below 100 is below-average.
At the four positions the NL leads, the average gap is 9 wRC+ points. At the four positions the AL leads, the average gap is only 7 wRC+ points. The NL has a bigger offensive edge at several individual positions, they're hitting (slightly) more home runs, and they're performing better with men in scoring position. That equals more runs scored per game, on average.
Furthermore, the NL has been gaining on the AL the last few years. This season simply continues that trend with the universal DH providing a nice boost. As noted earlier, the AL outscored the NL by only 0.10 runs per game last year. Five years ago it was 0.28 runs per game and five years before that it was 0.33 runs per game. The gap is shrinking.
Weird things are going to happen in this 60-game season -- if this were a normal 162-game season, we'd just now be approaching Memorial Day -- but the NL comfortably outscoring the AL is not as weird as it may seem. They've been gaining ground the last few seasons and the universal DH may be here to stay. This may be the new normal.